Chart: Scoring At The 2014 World Cup Has Been Bonkers

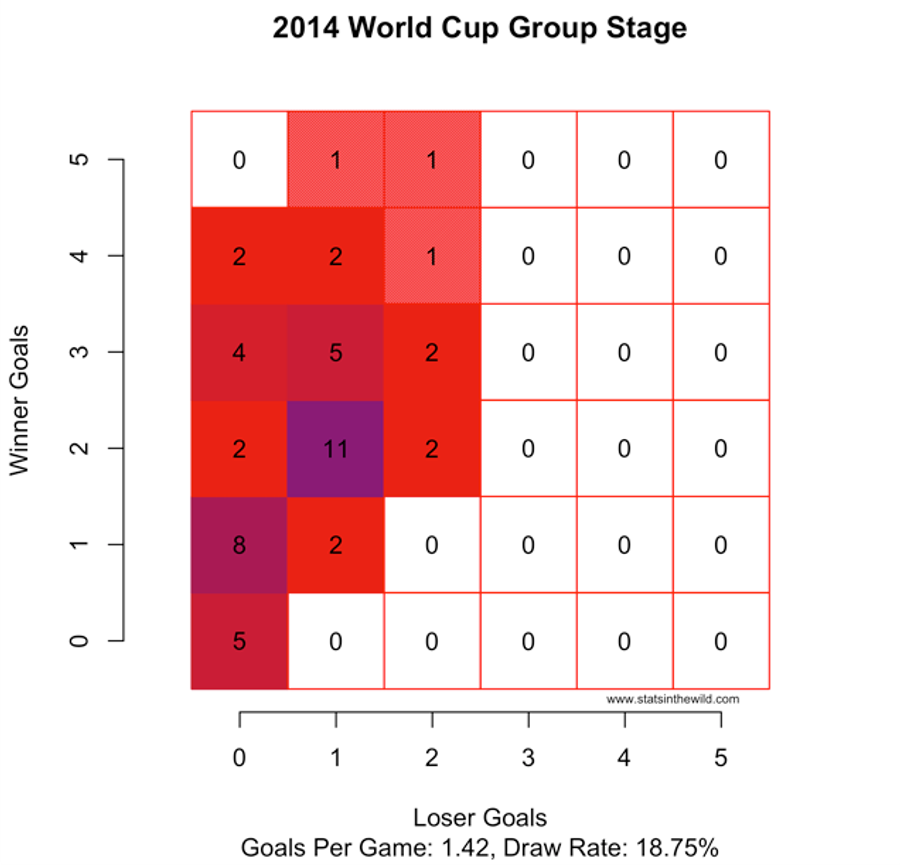
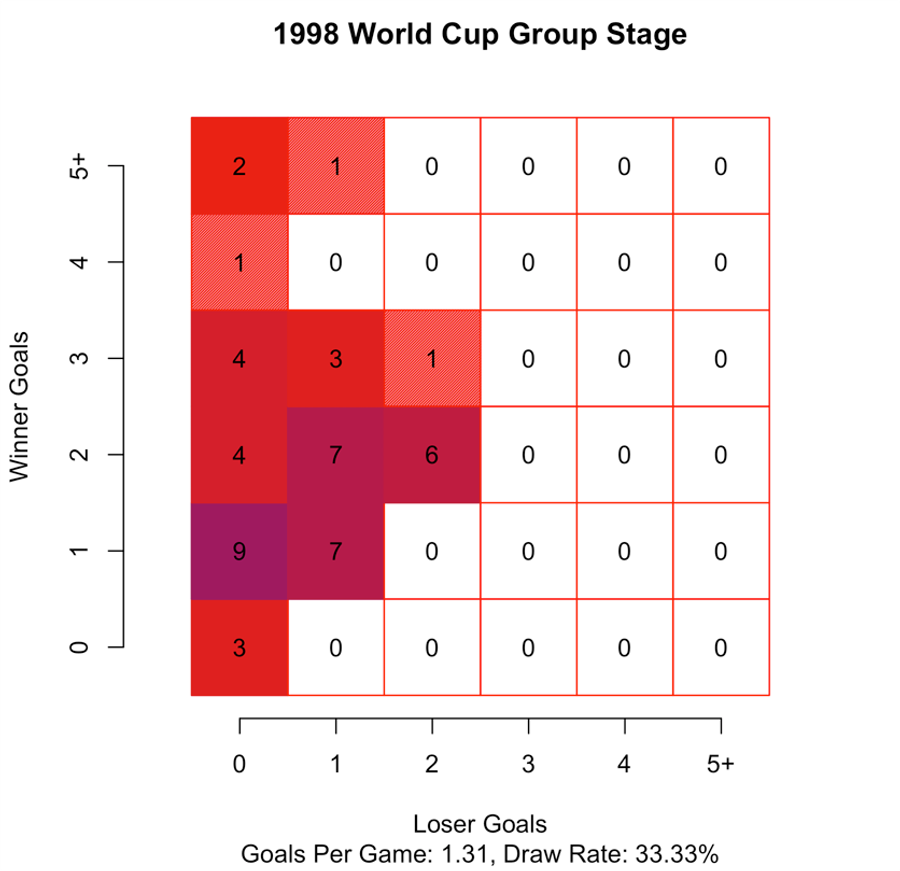
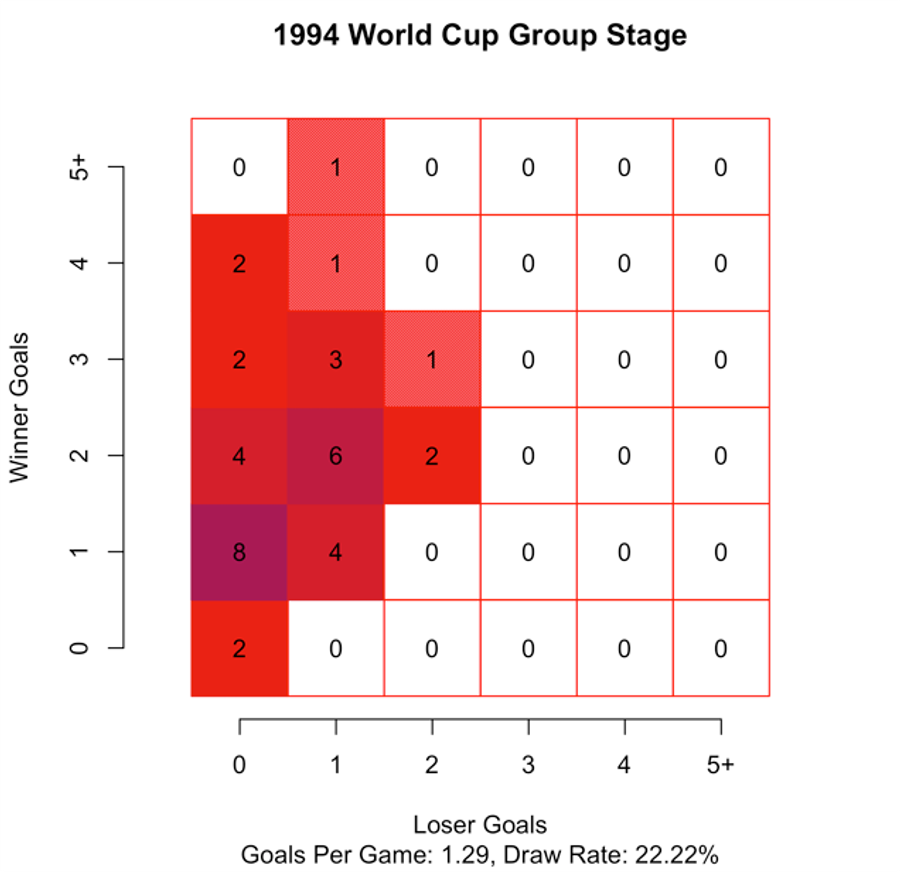
Over on Stats In the Wild, Gregory Matthews has visualized how much scoring there's been at the 2014 World Cup, using the clever grid chart you see above. The goals of the "winning" team—draws are included—are the y-axix, and the losing team is the x-axis. Each square is labeled (and colored) with the number of times that particular outcome occurred; the most common outcome, a 2-1 win, occurred in eleven games.
On average, there were 1.42 goals per game per team in the 2014 group stage, the highest figure in the last six World Cups. Only 19 percent of games ended in a draw, the lowest figure over the last six Cups. To compare, the average NFL team scored 2.61 touchdowns per game last season, and five teams—the Bucs, Ravens, Texans, Jets, and Jaguars—scored fewer than two.
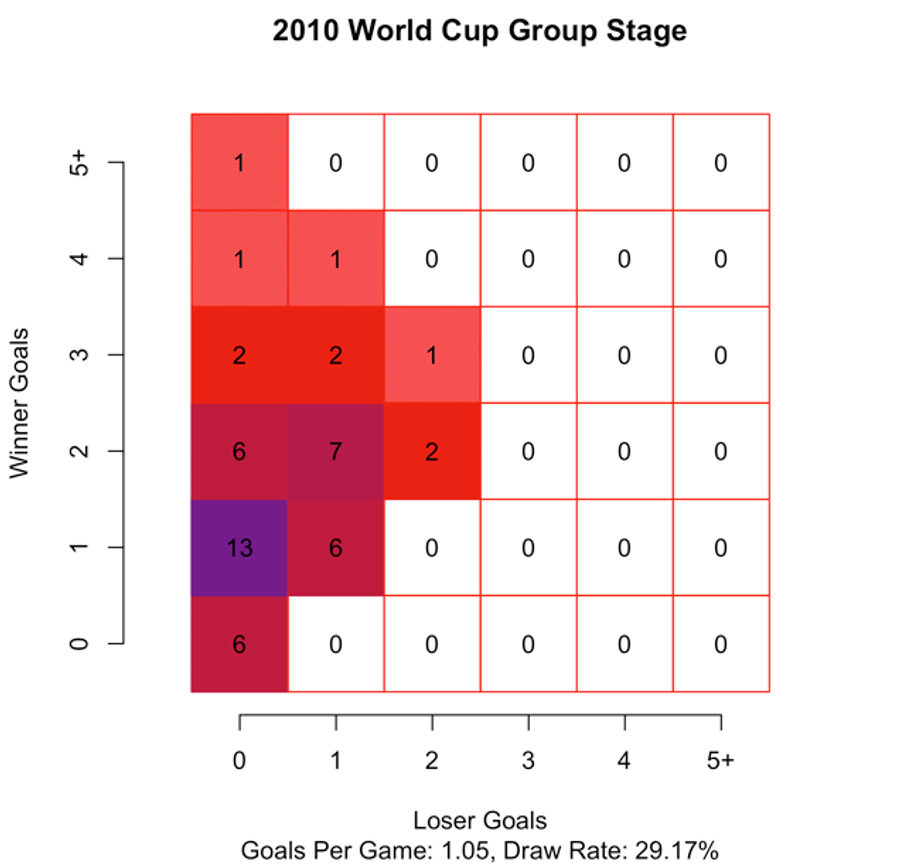
Here's the chart for 2010, which was particularly low-scoring:
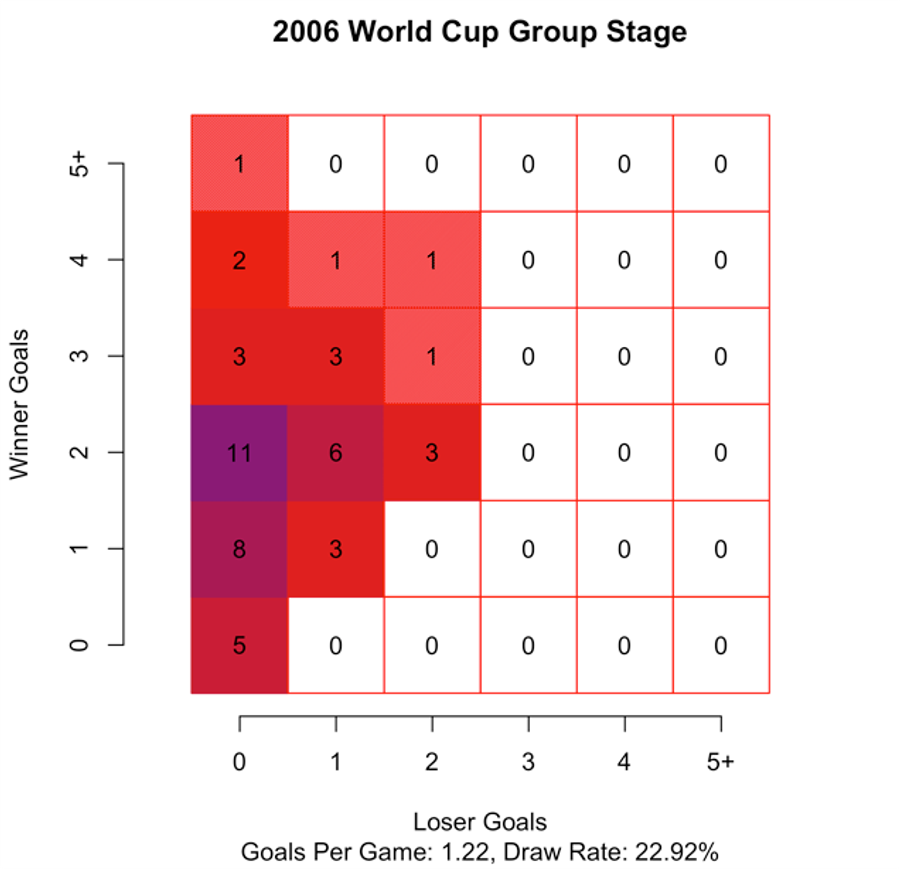
Here's 2006:
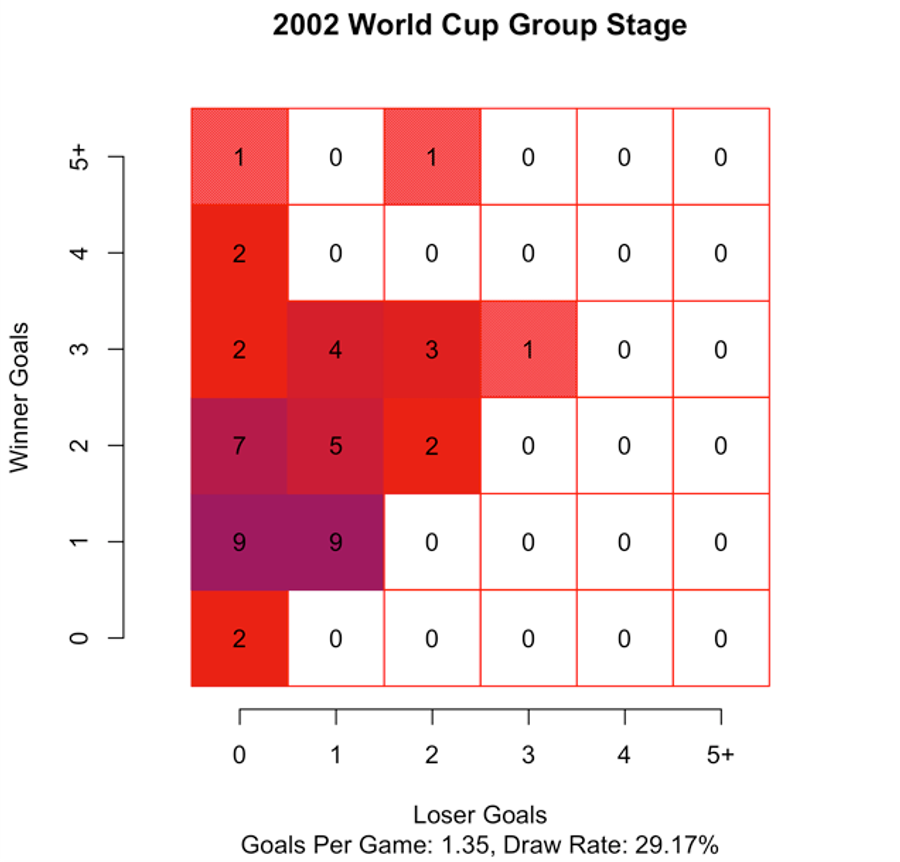
2002:
1998:
And here's 1994, which had 12 fewer matches:
Related


Everything to Know About the 2025 NBA Cup Quarterfinals


Next Big Stars in WWE: Watch These 2026 Breakout Stars

The AFC Is Wide Open Heading Into Week 15

Kansas City Chiefs Need Offensive Changes This Offseason
- Eagles vs Chargers Monday Night Football Betting Prediction: Week 14 Bet Picks
- NBA Best Bets Today: Sunday Dec. 7th Top NBA Picks
- Texans vs Chiefs Sunday Night Football Betting Prediction: Week 14 Bet Picks
- Top 10 NFL Player Props for Week 14: Best Bets and Expert Picks
- College Football Conference Championship Best Betting Picks, Predictions
- UFC 323 Betting Picks: Best Bets for the Final ESPN Pay-Per-View
- NBA Best Bets Today: Top Betting Predictions for Friday Dec. 5th