Chart: How Does Your NFL Team Stack Up On Offense and Defense?

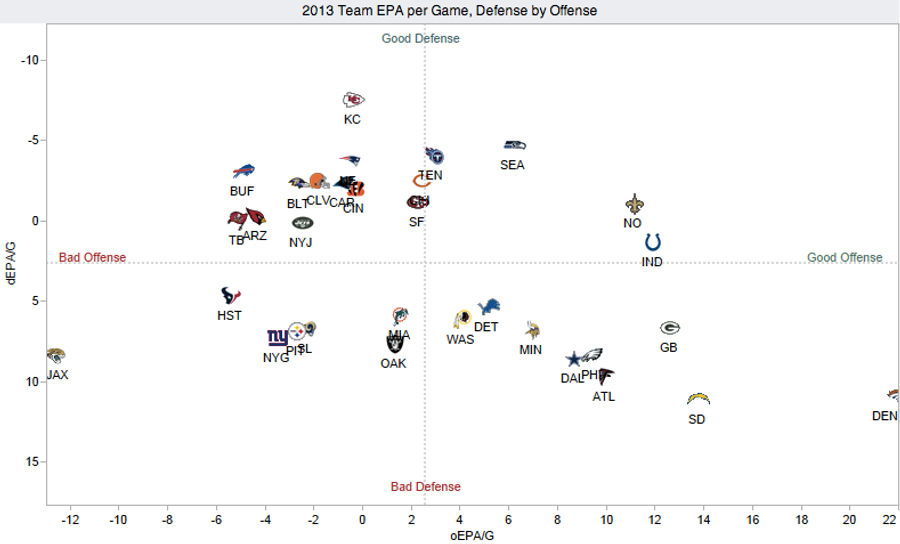
Over at Advanced NFL Stats, Brian Burke has put together a great visualization plotting the offensive and defensive performance of the league's 32 teams. It's nothing too complicated—basically a NYMag Approval Matrix for football—but it reveals a lot about the state of the NFL through Week 5.
The measurement here is expected points added (EPA) per game, which sums how much a team's offense has increased the odds of scoring, or a team's defense has decreased those odds, following every play ( similar to RE24 in baseball). This type of stat acknowledges that not all situations are equal—yards per game might be a useful comparative figure, but five yards on 2nd and 10 and five yards on 3rd and 4 aren't the same thing. The axes are set at the league averages, so even a slightly negative EPA defense like the Colts can qualify as "good" in today's NFL.
The scales had to be adjusted to fit the Broncos, but who would have guessed that the Colts attack would come in fourth? How many more points does Matt Schaub have to hand his opponents before the Texans' offense drops below the Jags? And what teams are going to distinguish themselves from the "decent D/medicore O" clusterfuck in the top left? Stay tuned, these update every week.
Related

Everything to Know About the 2025 NBA Cup Quarterfinals


Next Big Stars in WWE: Watch These 2026 Breakout Stars

The AFC Is Wide Open Heading Into Week 15

Kansas City Chiefs Need Offensive Changes This Offseason
- Eagles vs Chargers Monday Night Football Betting Prediction: Week 14 Bet Picks
- NBA Best Bets Today: Sunday Dec. 7th Top NBA Picks
- Texans vs Chiefs Sunday Night Football Betting Prediction: Week 14 Bet Picks
- Top 10 NFL Player Props for Week 14: Best Bets and Expert Picks
- College Football Conference Championship Best Betting Picks, Predictions
- UFC 323 Betting Picks: Best Bets for the Final ESPN Pay-Per-View
- NBA Best Bets Today: Top Betting Predictions for Friday Dec. 5th